How To Use Power Query To Clean Data In Excel
Cleaning Data with Power Query in Excel
Power Query, also known as “Get & Transform Data” in Excel, is a powerful data transformation and data preparation engine. It allows you to import data from various sources, clean, shape, and transform it, and load it into Excel for analysis. Cleaning data is a crucial step in any data analysis workflow, and Power Query provides a user-friendly and efficient way to accomplish this task.
Why Use Power Query for Data Cleaning?
- Visual Interface: Power Query offers a graphical user interface, making data cleaning accessible to users without extensive programming knowledge.
- Repeatable Process: Once you define a cleaning process, Power Query saves it as a query. You can easily refresh the query to apply the same transformations to new data.
- Variety of Transformations: Power Query provides a rich set of transformations, allowing you to handle various data cleaning challenges.
- Data Source Flexibility: Connect to data from a wide range of sources, including Excel files, CSV files, databases, web pages, and more.
- Reduces Manual Effort: Automate repetitive cleaning tasks, saving time and reducing the risk of errors.
Getting Started with Power Query
- Accessing Power Query: In Excel, go to the “Data” tab on the ribbon. The “Get & Transform Data” group contains the Power Query commands.
- Importing Data: Click “Get Data” and choose the data source. Follow the prompts to connect to your data. For example, to import an Excel file, select “From File” > “From Workbook.”
- Power Query Editor: Once the data is imported, the Power Query Editor opens. This is where you’ll perform your data cleaning transformations.
Common Data Cleaning Transformations in Power Query
Here’s a breakdown of some commonly used data cleaning techniques you can apply within the Power Query Editor:
1. Removing Rows and Columns
- Removing Columns: Select the column(s) you want to remove, right-click, and choose “Remove” or “Remove Other Columns” (to keep only the selected columns).
- Removing Rows:
- Remove Top Rows: Removes the first specified number of rows. Useful for skipping header rows or introductory information. Use “Home” > “Reduce Rows” > “Remove Top Rows.”
- Remove Bottom Rows: Removes the last specified number of rows. Useful for removing footers or summary lines. Use “Home” > “Reduce Rows” > “Remove Bottom Rows.”
- Remove Alternate Rows: Removes every nth row, starting from a specified row. Use “Home” > “Reduce Rows” > “Remove Alternate Rows.”
- Remove Errors: Removes rows containing errors. Use “Home” > “Reduce Rows” > “Remove Errors.”
- Filter Rows: Keep or remove rows based on specific criteria (see filtering below).
2. Filtering Data
Filtering allows you to keep only the rows that meet specific criteria. Click the filter icon (arrow) in the column header to access the filtering options.
- Text Filters: Filter text columns based on criteria like “Equals,” “Begins With,” “Contains,” etc.
- Number Filters: Filter number columns based on criteria like “Equals,” “Greater Than,” “Less Than,” “Between,” etc.
- Date Filters: Filter date columns based on criteria like “Equals,” “Before,” “After,” “Between,” etc. Power Query understands and handles date formats effectively.
- Custom Filters: Create more complex filtering conditions using formulas.
3. Handling Missing Values
Missing values (represented as “null” in Power Query) can cause issues in your analysis. Here’s how to handle them:
- Replacing Missing Values: Select the column, go to “Transform” > “Replace Values,” and replace “null” with a suitable value like 0, the column mean, or a blank string.
- Filling Down/Up: If missing values are interspersed in a sequential column, you can fill them with the value from the row above or below. Select the column, go to “Transform” > “Fill” > “Down” or “Up.” This is useful for data where values are only recorded once and implied for subsequent rows.
4. Transforming Data Types
Ensuring columns have the correct data type is essential for calculations and analysis. Power Query automatically detects data types, but you may need to adjust them.
- Changing Data Type: Click the icon to the left of the column header to change the data type. Available types include Text, Number (Integer, Decimal), Date, Time, DateTime, Boolean, etc.
- Using Locale: If your data contains numbers or dates with different regional formatting, use the “Using Locale…” option when changing the data type to ensure proper conversion.
5. Text Transformations
Power Query offers a wide array of functions for manipulating text data.
- Trimming Whitespace: Remove leading and trailing spaces using “Transform” > “Format” > “Trim.”
- Cleaning Text: Remove non-printable characters using “Transform” > “Format” > “Clean.”
- Changing Case: Convert text to uppercase, lowercase, or proper case using “Transform” > “Format” > “Uppercase,” “Lowercase,” or “Capitalize Each Word.”
- Extracting Text: Extract portions of text using “Transform” > “Extract” (e.g., First Characters, Last Characters, Range, Text Before Delimiter, Text After Delimiter).
- Splitting Columns: Split a single column into multiple columns based on a delimiter using “Transform” > “Split Column” > “By Delimiter.”
- Replacing Text: Replace specific text strings with other strings using “Transform” > “Replace Values.” You can use this to correct misspellings, standardize abbreviations, or remove unwanted characters.
6. Date Transformations
Power Query provides several options for working with dates and times.
- Extracting Date/Time Components: Extract year, month, day, hour, minute, second using “Transform” > “Date” or “Time” (e.g., Date > Year > Year).
- Calculating Date Differences: Calculate the difference between two dates. You might need to add a custom column for this.
- Converting Date Formats: Change the format of dates using “Transform” > “Date” > “Format.” Be mindful of locale settings when doing so.
7. Adding Custom Columns
You can create new columns based on formulas using the Power Query formula language (M). This allows for complex transformations and calculations.
- Add Column: Go to “Add Column” > “Custom Column.”
- Formulas: Write formulas using the M language. The formula editor provides helpful intellisense. For example, to concatenate two columns:
=[Column1] & " " & [Column2] - Conditional Logic: Use `if…then…else` statements to create conditional columns. For example:
if [ColumnA] > 10 then "High" else "Low"
8. Pivoting and Unpivoting Data
Pivoting transforms rows into columns, and unpivoting transforms columns into rows. This is useful for reshaping data for analysis.
- Pivot Column: Go to “Transform” > “Pivot Column.” Select the column that contains the values to become column headers, and the column that contains the values to populate the new columns.
- Unpivot Columns: Go to “Transform” > “Unpivot Columns” (select the columns you want to unpivot). This combines multiple columns into two columns: “Attribute” (the original column header) and “Value” (the corresponding value).
Applying and Refreshing Your Query
- Close & Load: Once you’ve finished cleaning your data, click “Home” > “Close & Load” (or “Close & Load To…”) to load the transformed data into an Excel worksheet.
- Refreshing Data: To update the data with the latest changes from the source, right-click on the data table in Excel and choose “Refresh.” This will re-run the Power Query steps. You can also refresh all connections from the “Data” tab.
Best Practices for Data Cleaning with Power Query
- Document Your Steps: Use the “Applied Steps” pane to track your transformations. You can rename the steps to make them more descriptive.
- Start with a Copy: Always work on a copy of your original data to avoid accidentally modifying the source.
- Test Your Transformations: Carefully review the results of each transformation to ensure it’s working as expected.
- Break Down Complex Transformations: Divide complex cleaning tasks into smaller, more manageable steps. This makes it easier to troubleshoot issues.
- Use Comments: Add comments to your M code in custom columns to explain your logic.
By mastering Power Query, you can significantly improve the quality and efficiency of your data analysis workflows in Excel. It empowers you to transform messy, inconsistent data into clean, usable information, enabling better insights and decision-making.
 978×548 excel clean data power query excel tips mrexcel publishing from www.mrexcel.com
  900×507 clean data power query excel tips mrexcel publishing from www.mrexcel.com
  960×513 power query clean messy report pivot from simplyexcelcoza.weebly.com
  1194×678 complete guide power query excel from www.howtoexcel.org
 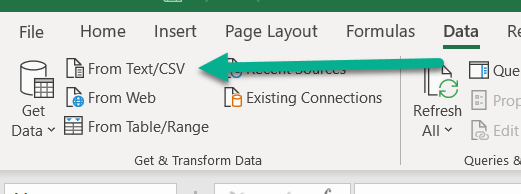 521×194 power query clean data filtering macrordinary from macrordinary.ca