How To Calculate Payback Period In Excel
“`html
Calculating Payback Period in Excel: A Comprehensive Guide
The payback period is a fundamental financial metric used to determine the amount of time it takes for an investment to generate enough cash flow to cover its initial cost. It’s a simple yet powerful tool for assessing the risk and potential return of a project. A shorter payback period generally indicates a less risky and more attractive investment. While the payback period has limitations (ignoring the time value of money and cash flows beyond the payback period), it provides a quick and easy way to compare different investment opportunities.
Excel is an excellent platform for calculating payback periods. This guide will walk you through various methods, from basic calculations to more complex scenarios involving uneven cash flows and fractional periods.
Understanding the Basics: Even Cash Flows
The simplest scenario involves consistent, even cash flows each period (usually annually). The formula for calculating the payback period in this case is:
Payback Period = Initial Investment / Annual Cash Flow
Let’s illustrate with an example. Imagine you invest $50,000 in a project that generates $10,000 in cash flow each year.
- Initial Investment: $50,000
- Annual Cash Flow: $10,000
To calculate the payback period in Excel:
- In cell A1, enter “Initial Investment”.
- In cell B1, enter 50000.
- In cell A2, enter “Annual Cash Flow”.
- In cell B2, enter 10000.
- In cell A3, enter “Payback Period”.
- In cell B3, enter the formula: =B1/B2.
The result in cell B3 will be 5, indicating a payback period of 5 years. This means it will take 5 years for the project to recoup the initial $50,000 investment.
Handling Uneven Cash Flows: The Cumulative Approach
More often than not, real-world projects generate uneven cash flows. In these cases, we need to use a cumulative cash flow approach. This involves tracking the cumulative cash flow over time until it equals or exceeds the initial investment.
Let’s consider a project with an initial investment of $100,000 and the following annual cash flows:
- Year 1: $20,000
- Year 2: $30,000
- Year 3: $40,000
- Year 4: $50,000
Here’s how to calculate the payback period in Excel:
- In cell A1, enter “Year”.
- In cell B1, enter “Cash Flow”.
- In cell C1, enter “Cumulative Cash Flow”.
- In cell A2, enter 1.
- In cell A3, enter 2, and drag down to A5 (representing years 1 through 4).
- In cell B2, enter 20000.
- In cell B3, enter 30000.
- In cell B4, enter 40000.
- In cell B5, enter 50000.
- In cell C2, enter the formula: =B2-$100000 (Initial Investment is negative, so subtract from it, you can store the initial investment separately in a cell (D1=100000), then formula will be =B2-D1).
- In cell C3, enter the formula: =C2+B3.
- Drag the formula in cell C3 down to cell C5.
Now, analyze the “Cumulative Cash Flow” column (Column C). You’ll see the following:
- Year 1: -$80,000
- Year 2: -$50,000
- Year 3: -$10,000
- Year 4: $40,000
The cumulative cash flow turns positive between Year 3 and Year 4. This means the payback period lies somewhere within that year.
Calculating the Fractional Year
To determine the exact payback period, we need to calculate the fractional year. Here’s the formula:
Fractional Year = (Amount Needed to be Recovered / Cash Flow in the Following Year)
In our example:
- Amount Needed to be Recovered: $10,000 (the negative cumulative cash flow at the end of Year 3)
- Cash Flow in the Following Year (Year 4): $50,000
In Excel, you can add these to your spreadsheet:
- In cell A6, enter “Amount Needed”.
- In cell B6, enter the formula: =ABS(C4) (taking the absolute value of the Year 3 cumulative cash flow).
- In cell A7, enter “Fractional Year”.
- In cell B7, enter the formula: =B6/B5.
- In cell A8, enter “Payback Period”.
- In cell B8, enter the formula: =A4+B7 (Year where Payback is closest + Fractional Year) =3+B7 would also work
The value in B7 will be 0.2. Therefore, the fractional year is 0.2 years.
The final payback period in cell B8 is 3.2 years (3 years + 0.2 years).
Using Excel Functions for Efficiency (Optional)
While the step-by-step approach is clear, you can use Excel functions to streamline the process, especially when dealing with large datasets. The `XMATCH` and `INDEX` functions can be particularly helpful.
XMATCH: This function returns the relative position of an item in an array. We can use it to find the first positive cumulative cash flow.
INDEX: This function returns a value from a range based on its position. We can use it to retrieve the cash flow of the year following the payback.
Continuing with the previous uneven cash flow example (Initial investment of $100,000 and cash flows as before):
- Add a row at the top (Row 1) and label the first row, second, and third column as “Year”, “Cash Flow”, “Cumulative Cash Flow”. In the “year” column put 0 instead of 1 in the second row. In cash flow, use -100000. The formulas stay the same.
- In cell A9, enter “Payback Period (Formula)”.
- In cell B9, enter the following (complex) formula:
C2:C6>=0: This creates an array of TRUE/FALSE values depending on if cumulative cash flow is greater or equal to 0.XMATCH(TRUE,C2:C6>=0): This finds the *position* (row number within the range) of the *first* TRUE value in the array created by the previous step. This corresponds to the first year where cumulative cash flow turns positive.XMATCH(TRUE,C2:C6>=0)+1:This increments by 1 to get the actual year.INDEX(B2:B6,XMATCH(TRUE,C2:C6>=0)): This retrieves the *cash flow* from the *year* before the payback period (i.e., the last year the cumulative cash flow was negative). It uses the position found by XMATCH to select from the `B2:B6` range.INDEX(C2:C6,XMATCH(TRUE,C2:C6>=0)): This will retrieve the cumulative cash flow for the current year.INDEX(B2:B6,XMATCH(TRUE,C2:C6>=0)+1): This retrieves the *cash flow* of the *year following* the last negative cumulative cash flow (the year where the payback occurs).-
(INDEX(B2:B6,XMATCH(TRUE,C2:C6>=0))/INDEX(B2:B6,XMATCH(TRUE,C2:C6>=0)+1)): This calculates the fractional portion of the year needed for payback.
=XMATCH(TRUE,C2:C6>=0)+1- (INDEX(B2:B6,XMATCH(TRUE,C2:C6>=0))/INDEX(B2:B6,XMATCH(TRUE,C2:C6>=0)+1))
Explanation of the formula components:
This complex formula does the same calculation as the individual formulas did above.
Cell B9 will show 3.2, confirming our previous calculation. While this formula is more complex, it encapsulates the entire calculation into a single cell, making it convenient for dynamic analysis and scenarios involving many projects.
Important Considerations and Limitations
- Discounted Payback Period: As mentioned, the simple payback period ignores the time value of money. The discounted payback period addresses this by discounting future cash flows back to their present value. This provides a more accurate assessment of the payback time, especially for projects with long lifespans. Calculating the discounted payback period involves adding a discount rate to each year’s cash flow. You would apply a discount factor to each year’s cash flow and then use the cumulative cash flow approach described above.
- Cash Flows Beyond Payback: The payback period only considers cash flows up to the point where the initial investment is recovered. It doesn’t account for any cash flows generated after that, which could be significant and make a project more attractive. Therefore, it should be used in conjunction with other financial metrics like Net Present Value (NPV) and Internal Rate of Return (IRR).
- Accuracy of Cash Flow Estimates: The accuracy of the payback period is highly dependent on the accuracy of the cash flow projections. Unrealistic or overly optimistic cash flow forecasts can lead to misleading payback periods.
Conclusion
Calculating the payback period in Excel is a straightforward process that can be adapted to handle both even and uneven cash flow scenarios. While it has limitations, it remains a valuable tool for initial screening of investment opportunities and assessing their relative risk. By understanding the different methods and using Excel effectively, you can gain valuable insights into the financial viability of your projects.
“`
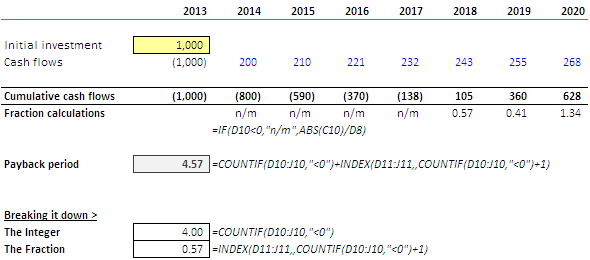 590×260 calculate payback period excel techtites from techtites.com
 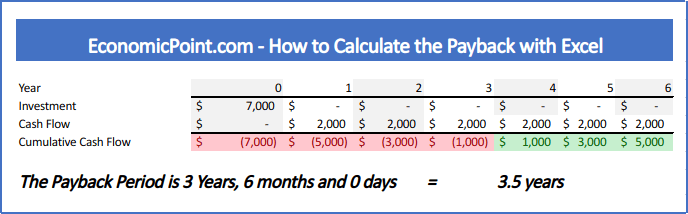 688×214 calculate payback period excel from economicpoint.com
  1946×1000 payback period calculate bookstime from www.bookstime.com
  625×299 payback period formula calculator excel template from www.educba.com