Annual Budget Planner Excel With Income Vs Expenses
Annual Budget Planner in Excel: A Detailed Guide to Income vs. Expenses
Creating and maintaining an annual budget is a cornerstone of sound financial management. An Excel spreadsheet provides a powerful and flexible tool to track your income and expenses, enabling you to gain a clear understanding of your financial health and make informed decisions about your spending and saving habits. This guide will walk you through building a comprehensive annual budget planner in Excel, focusing on the crucial balance between income and expenses.
Why Use Excel for Your Budget?
While dedicated budgeting apps exist, Excel offers several advantages:
- Customization: You have complete control over the spreadsheet’s design and formulas, tailoring it to your specific needs and financial situation.
- Flexibility: Easily add or modify categories, adjust formulas, and experiment with different scenarios.
- No Subscription Fees: Unlike many budgeting apps, Excel requires a one-time purchase or subscription (depending on the Microsoft Office version), eliminating ongoing costs.
- Data Ownership: Your data resides on your computer, giving you full control and privacy.
- Familiarity: Many people are already familiar with Excel, reducing the learning curve.
Setting Up Your Annual Budget Planner in Excel
Let’s create a basic annual budget planner. We’ll focus on a monthly breakdown for the year, comparing income against expenses.
1. Creating the Worksheet Layout
Open a new Excel workbook. Name the first sheet “Annual Budget”. Here’s a suggested layout:
- Column A: Category (e.g., Income, Rent, Groceries)
- Column B: January
- Column C: February
- Column D: March
- Column E: April
- Column F: May
- Column G: June
- Column H: July
- Column I: August
- Column J: September
- Column K: October
- Column L: November
- Column M: December
- Column N: Annual Total
In cell A1, enter “Category”. In cells B1 through M1, enter the months of the year. In cell N1, enter “Annual Total”. Adjust column widths as needed for readability.
2. Defining Income Categories
Under “Category” in column A, list your income sources. Examples:
- Salary
- Freelance Income
- Investment Income
- Rental Income
- Other Income
- Total Income (Leave this row blank for now; we’ll add a formula)
3. Defining Expense Categories
Below your income categories, list your expense categories. Break them down into as much detail as you need. Here are some common categories:
- Fixed Expenses: These are expenses that are relatively consistent each month.
- Rent/Mortgage
- Utilities (Electricity, Gas, Water, Internet)
- Loan Payments (Car, Student Loan)
- Insurance (Health, Car, Home)
- Subscriptions (Netflix, Spotify, etc.)
- Variable Expenses: These expenses fluctuate from month to month.
- Groceries
- Dining Out
- Transportation (Gas, Public Transit)
- Entertainment
- Clothing
- Personal Care
- Gifts
- Travel
- Medical Expenses
- Savings/Investments: Treat these as expenses to ensure you’re saving consistently.
- Retirement Contributions (401k, IRA)
- Emergency Fund
- Other Investments
- Debt Repayment: Separate from loan payments, include extra payments towards debt reduction.
- Credit Card Payments
- Total Expenses (Leave this row blank for now; we’ll add a formula)
4. Adding Formulas for Total Income and Total Expenses
In the “Total Income” row, enter the following formula in cell B[row number of Total Income]:
=SUM(B[row number of Salary]:B[row number of Other Income])
Replace the bracketed placeholders with the actual row numbers for your spreadsheet. For example, if Salary is in row 2 and Other Income is in row 5, the formula would be `=SUM(B2:B5)`. Drag this formula across from column B to column M (January to December).
Similarly, in the “Total Expenses” row, enter the following formula in cell B[row number of Total Expenses]:
=SUM(B[row number of Rent/Mortgage]:B[row number of Credit Card Payments])
Replace the bracketed placeholders with the actual row numbers for your spreadsheet. Drag this formula across from column B to column M (January to December).
5. Adding the Annual Total Column
In the “Annual Total” column (Column N), add formulas to calculate the total for each category across the year. For example, in cell N2 (next to Salary), enter:
=SUM(B2:M2)
Drag this formula down to apply it to all income and expense categories.
6. Calculating Net Income (Surplus or Deficit)
Add a row below “Total Expenses” called “Net Income (Surplus/Deficit)”. In cell B[row number of Net Income], enter the formula:
=B[row number of Total Income]-B[row number of Total Expenses]
Replace the bracketed placeholders with the correct row numbers. Drag this formula across from column B to column M (January to December) and down to column N (Annual Total) to calculate the annual net income.
7. Entering Your Income and Expenses
Now comes the time-consuming but crucial part: entering your expected or actual income and expenses for each month. Use bank statements, credit card statements, and receipts to gather accurate data. Be as realistic as possible. If you anticipate a bonus in June, include it in the “Salary” category for June.
Advanced Features to Enhance Your Budget
Once you have a basic budget in place, consider adding these advanced features:
Conditional Formatting
Use conditional formatting to highlight areas of concern. For example:
- Highlight months with a negative net income (deficit) in red.
- Highlight expense categories that exceed a certain threshold in a specific month.
To apply conditional formatting to the Net Income row: select the Net Income row (B[row number of Net Income]:M[row number of Net Income]), go to “Conditional Formatting” on the “Home” tab, choose “Highlight Cells Rules”, and select “Less Than”. Enter “0” and choose a red fill. Repeat the process for positive values (greater than 0) using a green fill.
Variance Analysis
Add a new sheet called “Variance Analysis.” This sheet will compare your budgeted amounts to your actual spending.
- Copy the Category list from the “Annual Budget” sheet to Column A of the “Variance Analysis” sheet.
- Create columns for “Budgeted Amount” and “Actual Amount” for each month (e.g., “Jan Budgeted”, “Jan Actual”, “Feb Budgeted”, “Feb Actual”, etc.).
- Enter your budgeted amounts from the “Annual Budget” sheet into the “Budgeted Amount” columns.
- As the months progress, enter your actual spending in the “Actual Amount” columns.
- Create a “Variance” column for each month, calculating the difference between the Budgeted and Actual amounts. For example, for January: `=[Cell containing “Jan Budgeted”] – [Cell containing “Jan Actual”]`.
- Use conditional formatting in the “Variance” columns to highlight variances exceeding a certain percentage or dollar amount, alerting you to areas where you’re over or underspending.
Charts and Graphs
Visualize your budget data with charts and graphs. Excel offers various chart types:
- Pie Charts: Show the percentage breakdown of your income and expenses.
- Line Charts: Track your income, expenses, and net income over time.
- Column Charts: Compare budgeted versus actual expenses for each month.
To create a chart, select the data you want to visualize, go to the “Insert” tab, and choose a chart type.
Scenario Planning
Use Excel’s scenario manager to create different budget scenarios based on potential changes in income or expenses. For example, you could create scenarios for:
- Job Loss
- Unexpected Medical Expenses
- Increased Investment Income
Go to the “Data” tab and select “What-If Analysis” -> “Scenario Manager”. Define your scenarios and the cells that will change (e.g., Salary, Medical Expenses) within each scenario.
Tips for Maintaining Your Budget
- Track Your Spending Regularly: Update your budget at least weekly, or ideally daily, to stay on top of your finances.
- Be Honest with Yourself: Don’t underestimate your spending or overestimate your income.
- Review and Adjust: Review your budget regularly (monthly or quarterly) and make adjustments as needed based on your actual spending patterns and any changes in your financial situation.
- Categorize Consistently: Ensure that you categorize your expenses consistently to get an accurate picture of your spending habits.
- Use Automation: Link your bank and credit card accounts to your Excel spreadsheet (if your bank and version of Excel support it) to automatically import transactions. Be cautious about security when doing this.
- Set Realistic Goals: Don’t try to cut back too drastically at once. Start with small, achievable changes.
Conclusion
An annual budget planner in Excel provides a powerful and customizable tool for managing your finances. By diligently tracking your income and expenses and regularly reviewing your budget, you can gain valuable insights into your spending habits, identify areas for improvement, and achieve your financial goals. Remember to personalize your budget to fit your unique circumstances and make adjustments as needed. Consistent monitoring and adjustments are key to long-term financial success.
 474×273 income expenses spreadsheet budget templates from db-excel.com
  842×588 budget expenses template excel templates from myexceltemplates.com
  1464×829 budget actual spreadsheet intended budget templates from db-excel.com
 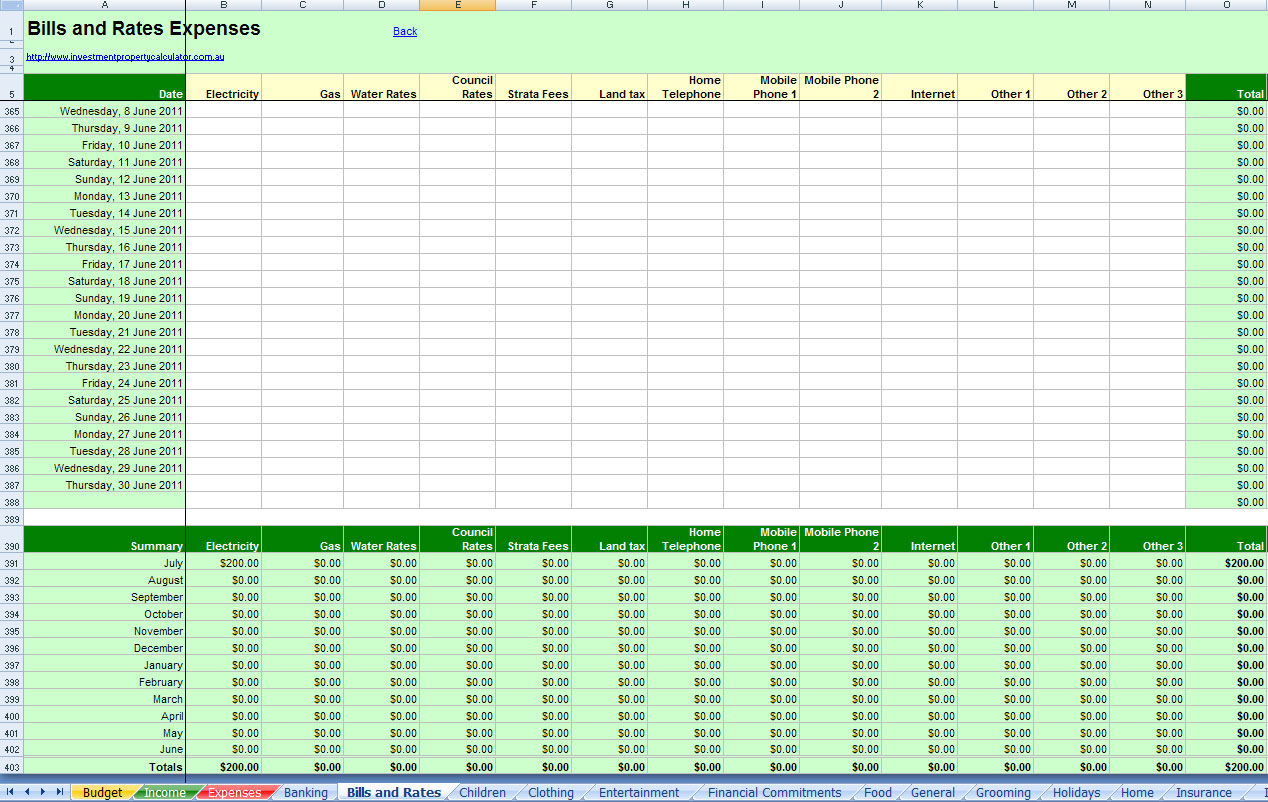 1268×802 comprehensive budget planner spreadsheet excel spreadsheet from db-excel.com
  601×371 budget actual spreadsheet template google spreadshee budget from db-excel.com
  1308×1499 budget actual spreadsheet template adnia solutions from adniasolutions.com
  1365×729 family personal cash flowbudgeting sharing budget actual from familycashflowandbudgeting.blogspot.com