How To Use Excel For Personal Net Worth Tracking
Tracking Your Net Worth with Excel: A Comprehensive Guide
Understanding your net worth is fundamental to achieving financial stability and reaching your long-term financial goals. It’s a snapshot of your financial health, representing the difference between what you own (assets) and what you owe (liabilities). While sophisticated financial software exists, Microsoft Excel provides a powerful and customizable platform for tracking your net worth effectively. This guide will walk you through the process of setting up and using an Excel spreadsheet to monitor your personal net worth.
1. Setting Up Your Excel Spreadsheet
Start by opening a new Excel workbook. We’ll structure the spreadsheet into sections for Assets, Liabilities, and Net Worth. Consider these initial column headers:
- Date: The date for which you are recording your net worth. It’s best to track it consistently (e.g., monthly, quarterly).
- Asset Category: A broad category of your assets (e.g., Cash, Investments, Real Estate).
- Asset Description: A more specific description of the asset (e.g., Checking Account, Stocks, Primary Residence).
- Value: The current market value of the asset.
- Liability Category: A broad category of your liabilities (e.g., Debt, Loans).
- Liability Description: A more specific description of the liability (e.g., Credit Card, Mortgage, Student Loan).
- Amount Owed: The current outstanding balance of the liability.
Create these columns in the first row of your spreadsheet. You might also want to freeze the top row (View > Freeze Panes > Freeze Top Row) to keep the headers visible as you scroll down.
2. Defining Your Asset Categories and Descriptions
This is where personalization comes in. Tailor your asset categories and descriptions to accurately reflect your financial situation. Here are some common examples:
Cash & Equivalents:
- Checking Account
- Savings Account
- Money Market Account
- Cash on Hand
Investments:
- Brokerage Account(s)
- Retirement Accounts (401(k), IRA, Roth IRA)
- Stocks
- Bonds
- Mutual Funds
- Exchange-Traded Funds (ETFs)
- Cryptocurrencies
- Real Estate Investment Trusts (REITs)
Real Estate:
- Primary Residence
- Rental Property(s)
- Vacation Home
Other Assets:
- Vehicles (Cars, Motorcycles, Boats)
- Collectibles (Art, Antiques, Jewelry)
- Business Equity
- Life Insurance (Cash Value)
Be as detailed as you need to be. If you have multiple brokerage accounts, list them separately. If you have a large collection of rare coins, that could be a separate asset line. The key is accurate representation.
3. Defining Your Liability Categories and Descriptions
Similar to assets, categorize and describe your liabilities meticulously:
Debt:
- Credit Card Debt
- Personal Loans
- Student Loans
- Medical Debt
Mortgages:
- Primary Residence Mortgage
- Rental Property Mortgage(s)
Other Liabilities:
- Car Loan
- Home Equity Line of Credit (HELOC)
- Business Loans
Again, break down liabilities into specific accounts for clarity. Knowing the details of each liability allows for better debt management.
4. Entering Your Data
Now, it’s time to populate your spreadsheet. Start with the most recent date for which you want to track your net worth (e.g., the end of the current month). Go through each asset and liability, recording the current value or amount owed. Be as accurate as possible.
- Cash and Bank Accounts: Check your online banking statements for current balances.
- Investments: Log into your brokerage and retirement accounts to find the current market value of your holdings.
- Real Estate: For your primary residence, you can use online real estate valuation tools (like Zillow or Redfin) for an estimate. For more accurate valuations, consider a professional appraisal, especially when refinancing. For rental properties, track their values separately.
- Vehicles: Use resources like Kelley Blue Book or Edmunds to estimate the current market value of your vehicles.
- Loans: Check your loan statements (credit card, mortgage, student loans, etc.) for the current outstanding balance.
Enter the data carefully to minimize errors. Double-check your numbers before moving on.
5. Calculating Your Net Worth
This is where Excel’s power shines. We’ll use formulas to automatically calculate your net worth.
Summing Assets:
In a cell below your asset list (e.g., in column D), use the SUM function to add up all the asset values. The formula will look something like this:
=SUM(D2:D10) (Adjust the range to match the rows containing your asset values)
Summing Liabilities:
Similarly, in a cell below your liability list (e.g., in column H), use the SUM function to add up all the liability amounts:
=SUM(H2:H8) (Adjust the range accordingly)
Calculating Net Worth:
In a separate cell (e.g., B1), create a label “Net Worth:”. In the cell next to it (e.g., C1), enter the formula to subtract total liabilities from total assets:
=D12-H10 (Assuming D12 contains the total asset value and H10 contains the total liability amount. Adjust accordingly).
Excel will automatically calculate and display your net worth based on the asset and liability values you’ve entered.
6. Tracking Net Worth Over Time
The real benefit of using Excel is the ability to track your net worth over time. Each month (or quarter), add a new row to your spreadsheet with the current date and updated asset and liability values. Copy and paste the formulas for calculating total assets, total liabilities, and net worth into the new row.
This will allow you to see how your net worth is trending over time. You can then use Excel’s charting features to visualize your progress.
7. Creating Charts to Visualize Your Progress
Excel’s charting tools can provide a visual representation of your net worth journey.
Line Chart for Net Worth Trend:
- Select the Date column and the Net Worth column.
- Go to Insert > Charts > Line Chart.
- Choose a simple line chart.
- Customize the chart title and axes labels for clarity.
Pie Chart for Asset Allocation:
- Select the Asset Category column and the corresponding Value column (for a specific date).
- Go to Insert > Charts > Pie Chart.
- Choose a pie chart.
- Customize the chart to show percentages or values.
These charts provide a clear picture of your financial health and progress.
8. Tips for Maintaining Your Spreadsheet
- Consistency is Key: Track your net worth regularly (e.g., monthly or quarterly) to get a consistent view of your financial progress.
- Accuracy Matters: Use accurate values for your assets and liabilities. Don’t guess; take the time to find the correct numbers.
- Backup Your Spreadsheet: Save your Excel file regularly and consider backing it up to the cloud (e.g., OneDrive, Google Drive, Dropbox) to prevent data loss.
- Customize as Needed: As your financial situation changes, adjust your asset and liability categories accordingly.
- Consider Conditional Formatting: Use conditional formatting to highlight certain values, such as assets that have increased significantly or liabilities that are getting close to being paid off.
- Protect Your Data: If you’re concerned about privacy, consider password-protecting your Excel file.
9. Advanced Features (Optional)
- Goal Tracking: Add a column to track specific financial goals (e.g., buying a house, retiring early) and monitor your progress toward those goals.
- Scenario Planning: Use Excel’s “What-If Analysis” tools to explore different scenarios (e.g., what if you increase your savings rate, what if the market crashes) and see how they might impact your net worth.
- Importing Data: Depending on your bank or brokerage, you might be able to export transaction data into a CSV file and then import that data into your Excel spreadsheet, streamlining the data entry process.
By following these steps, you can leverage the power of Excel to effectively track your net worth, gain valuable insights into your financial health, and make informed decisions to achieve your financial goals.
 586×1024 net worth calculator exceltemplatenet from exceltemplate.net
  1073×510 net worth spreadsheet important metric financial success from thedeepdish.org
  859×735 personal net worth calculator excel spreadsheet asset debt tracker from www.buyexceltemplates.com
  641×503 personal net worth statement template excel excel tmp from exceltmp.com
  794×704 net worth template excel etsy from www.etsy.com
 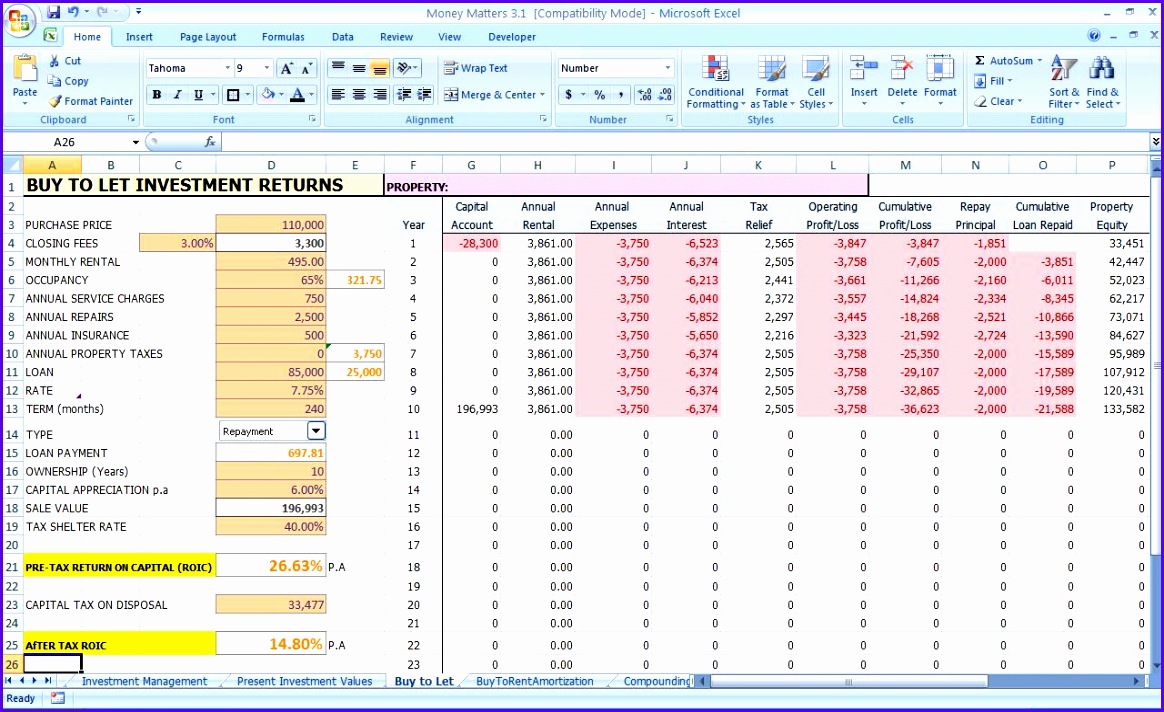 474×289 net worth excel template excel templates from www.exceltemplate123.us
  794×635 net worth tracker template excel track net worth net worth from www.etsy.com
  1920×1440 budgeting net worth tracker biz infograph from www.bizinfograph.com
 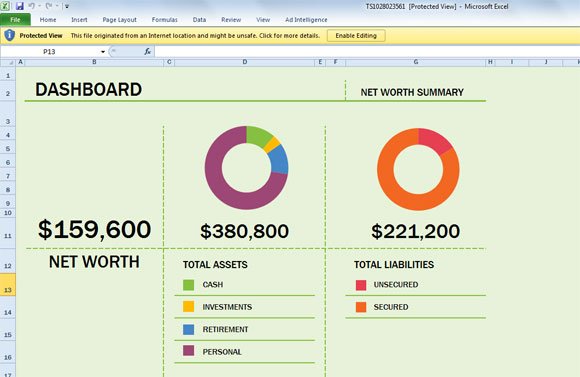 580×377 net worth spreadsheet template excel powerpoint from www.free-power-point-templates.com