How To Calculate IRR And NPV In Excel For Investments
“`html
Calculating IRR and NPV in Excel for Investment Analysis
When evaluating potential investments, two crucial metrics are Internal Rate of Return (IRR) and Net Present Value (NPV). Excel offers built-in functions that simplify the calculation of these key indicators, enabling informed decision-making. This guide provides a step-by-step explanation of how to calculate IRR and NPV using Excel, along with important considerations.
Understanding IRR and NPV
Before diving into the Excel functions, let’s briefly define these concepts:
- Net Present Value (NPV): NPV represents the present value of future cash flows, discounted at a specified rate, minus the initial investment. A positive NPV suggests that the investment is likely to be profitable, as the present value of the expected returns exceeds the initial cost. A negative NPV indicates a potential loss. The formula for NPV is:
NPV = Σ (Cash Flowt / (1 + Discount Rate)t) – Initial Investment Where:- Cash Flowt is the cash flow during period t
- Discount Rate is the rate of return that could be earned on an alternative investment
- t is the period number
- Internal Rate of Return (IRR): IRR is the discount rate that makes the NPV of all cash flows from a particular project equal to zero. In simpler terms, it’s the rate of return that an investment is expected to yield. A higher IRR generally indicates a more desirable investment, provided it exceeds the company’s cost of capital or hurdle rate. The IRR is found by solving the following for ‘r’:
0 = Σ (Cash Flowt / (1 + r)t) – Initial Investment Where:- Cash Flowt is the cash flow during period t
- r is the internal rate of return
- t is the period number
Calculating NPV in Excel
- Organize Your Data: Create a spreadsheet with two columns:
- Column A: Represents the period number (e.g., Year 0, Year 1, Year 2, etc.). Year 0 typically represents the initial investment.
- Column B: Represents the corresponding cash flows for each period. The initial investment (at Year 0) should be entered as a negative value.
- Determine the Discount Rate: Decide on an appropriate discount rate. This rate reflects the opportunity cost of capital, the riskiness of the project, and the desired rate of return. Enter this rate in a separate cell. For example, enter 10% in cell D1.
- Use the NPV Function: In a cell where you want to display the NPV, enter the following formula:
=NPV(D1, B2:B[last row]) + B1- Replace
D1with the cell containing your discount rate. - Replace
B2:B[last row]with the range of cells containing the cash flows, excluding the initial investment. The NPV function in Excel *assumes* that the cash flows start one period from now. B1is the cell containing the initial investment (the cash flow at Year 0). We add this because the NPV function calculates the present value of future cash flows.
For example, if your cash flows are in cells B1 to B5, and the discount rate is in D1, the formula would be:
=NPV(D1, B2:B5) + B1. - Replace
- Interpret the Result: The cell containing the NPV formula will display the calculated NPV. A positive value indicates a potentially profitable investment.
Example:
Assume the following data:
| Year | Cash Flow |
|---|---|
| 0 | -100,000 |
| 1 | 20,000 |
| 2 | 30,000 |
| 3 | 40,000 |
| 4 | 50,000 |
Discount Rate: 10% (in cell D1)
Excel Formula: =NPV(D1, B2:B5) + B1
Result: $10,431.86 (approximately)
This indicates a potentially profitable investment, as the NPV is positive.
Calculating IRR in Excel
- Organize Your Data: Similar to NPV, create a spreadsheet with two columns:
- Column A: Represents the period number.
- Column B: Represents the cash flows for each period, including the initial investment (as a negative value).
- Use the IRR Function: In a cell where you want to display the IRR, enter the following formula:
=IRR(B1:B[last row], [guess])- Replace
B1:B[last row]with the range of cells containing all cash flows, including the initial investment. [guess]is an optional argument representing an initial guess for the IRR. If omitted, Excel assumes a guess of 10% (0.1). While often not required, providing a guess can help Excel converge on the correct IRR, especially with unconventional cash flows. A reasonable guess can be based on similar investments or the company’s cost of capital. If the IRR result shows #NUM!, a guess should be provided.
For example, if your cash flows are in cells B1 to B5, the formula would be:
=IRR(B1:B5, 0.1). - Replace
- Format the Result: Format the cell containing the IRR formula as a percentage.
- Interpret the Result: The cell will display the calculated IRR. Compare the IRR to your company’s cost of capital or hurdle rate. If the IRR is higher, the investment may be considered worthwhile.
Example:
Using the same data as the NPV example:
| Year | Cash Flow |
|---|---|
| 0 | -100,000 |
| 1 | 20,000 |
| 2 | 30,000 |
| 3 | 40,000 |
| 4 | 50,000 |
Excel Formula: =IRR(B1:B5) or =IRR(B1:B5, 0.1)
Result: 12.01% (approximately)
If the company’s cost of capital is less than 12.01%, this investment could be considered. If the cost of capital is greater than 12.01%, then the investment might not be financially sound.
Important Considerations
- Cash Flow Accuracy: The accuracy of IRR and NPV calculations depends entirely on the accuracy of the cash flow projections. Ensure realistic and well-researched estimates.
- Discount Rate Selection: Choosing an appropriate discount rate is critical for NPV calculations. Consider factors like risk, opportunity cost, and inflation.
- Multiple IRRs: Some projects with unconventional cash flow patterns (e.g., cash outflows followed by inflows, then another outflow) may have multiple IRRs. This can make the IRR metric unreliable for decision-making in such cases. NPV is generally preferred in these scenarios.
- IRR Limitations: IRR assumes that cash flows are reinvested at the IRR itself, which may not be realistic. NPV is often considered a more reliable indicator of profitability as it uses a discount rate reflective of market conditions.
- Mutually Exclusive Projects: When comparing mutually exclusive projects (i.e., you can only choose one), selecting the project with the highest IRR may not always be optimal. In such cases, comparing NPVs is a better approach, especially if the projects have different initial investments or durations.
- Excel’s XIRR and XNPV: For investments with irregular timing of cash flows (i.e., not occurring at regular intervals), use the XIRR and XNPV functions in Excel. These functions require you to specify the dates of each cash flow. XNPV syntax is
XNPV(discount_rate, values, dates)and XIRR syntax isXIRR(values, dates, [guess]). Ensure the dates and cash flow values are in the correct corresponding order.
Conclusion
Excel provides a convenient and efficient way to calculate IRR and NPV, enabling investors to assess the potential profitability of investment opportunities. By understanding the principles behind these metrics and carefully applying the Excel functions, you can make more informed and data-driven investment decisions. Remember to consider the limitations of each method and to use them in conjunction with other financial analysis tools.
“`
 1365×700 npv irr calculator template excel template calculate net present from www.pinterest.com
  768×297 learn calculate npv irr excel excelchat from www.got-it.ai
  640×350 npv irr excel template periodic cash flows from www.ozgrid.com
  0 x 0 npv irr calculator excel template irr excel spreadsheet from www.someka.net
  1470×844 npv irr excel template vrogueco from www.vrogue.co
  1350×675 npv irr calculator excel template npv calculator net present from www.etsy.com
  1588×794 npv irr calculator excel template npv calculator net present irr from www.etsy.com
  632×460 ways calculate irr microsoft excel excel from www.howtoexcel.org
 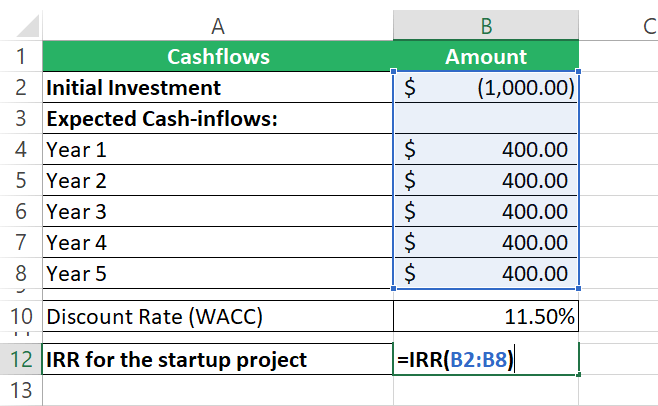 658×406 calculate npv excel npv formula explained from spreadsheeto.com
  1832×758 calculate irr excel irr function formula layer blog from blog.golayer.io
  1517×627 npv irr calculator excel template clccetedu from clc.cet.edu
  798×534 npv irr calculator excel template excel templates from www.exceltemplate123.us
  998×924 solved calculate npv irr project cheggcom from www.chegg.com
  180×234 npv irr excel exercisexlsx assume company opportunity from www.coursehero.com
  768×432 calculate net present npv internal rate return from howtoexcel.net
  1200×630 brilliant npv irr template excel p vrogueco from www.vrogue.co
  1280×720 financial analysis excel file npv irr calculations ryan from ryanoconnellfinance.com
  700×521 solved attached excel spreadsheet approximating cheggcom from www.chegg.com
  1833×1417 irr npv calculator template excel xls from flevy.com
  928×487 calculate irr excel methods technipages from www.technipages.com
 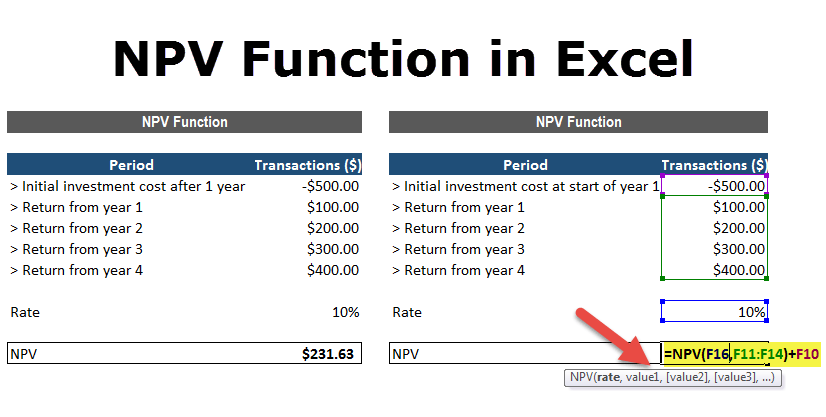 826×417 npv function excel formula examples from www.wallstreetmojo.com
  606×406 npv formula excel npv formula excel from www.educba.com
  1024×906 assess return npv irr time break excel from cfoperspective.com
  604×307 irr function excel step step tutorial from www.excel-easy.com