How To Create A Scoreboard In Excel For Sports Events
“`html
Creating a Sports Scoreboard in Excel
Excel can be a surprisingly versatile tool for creating dynamic and visually appealing scoreboards for various sports events. Whether you’re tracking a friendly neighborhood game or a competitive tournament, a well-designed Excel scoreboard can enhance the experience by providing real-time updates and clear presentation of scores. This guide walks you through the process of building a functional and customizable scoreboard in Excel.
1. Planning Your Scoreboard
Before diving into Excel, take some time to plan the layout and features of your scoreboard. Consider the following:
- Sport: The specific sport will dictate the necessary data fields. For example, a basketball scoreboard needs points, fouls, and timeouts, while a soccer scoreboard needs goals, shots on goal, and yellow/red cards.
- Teams: Identify the teams involved and their names.
- Key Metrics: List all the statistics you want to track (e.g., score, time remaining, player statistics).
- Visual Appeal: Think about color schemes, fonts, and overall design to make the scoreboard easy to read and engaging.
- Dynamic Elements: Consider how you’ll input data and how the scoreboard will update automatically.
2. Setting Up the Spreadsheet
Open a new Excel workbook and begin structuring your spreadsheet. Here’s a basic layout example (adapt to your sport’s needs):
A. Team Information
Allocate rows or columns for team names and any relevant information like team logos (inserted as pictures) or team colors (used for cell backgrounds).
| Column | Content |
|---|---|
| A | Team 1 Name |
| B | Team 1 Logo (Optional) |
| C | Team 1 Score |
| D | Separator (e.g., “-“) |
| E | Team 2 Score |
| F | Team 2 Logo (Optional) |
| G | Team 2 Name |
B. Score Tracking
Designate cells to display the scores. These cells will be updated during the game.
C. Time Remaining/Period
Include cells for tracking the time remaining in the game and the current period or quarter.
D. Other Statistics
Add rows for tracking other relevant statistics. For example:
- Fouls (Basketball)
- Shots on Goal (Soccer)
- Strikes/Balls (Baseball)
E. Control Panel (Optional)
A “control panel” area can contain buttons or input fields to easily adjust the score and other metrics. This uses Excel’s Developer tab features which are covered in detail below.
3. Implementing Dynamic Features
The key to a useful scoreboard is its ability to update dynamically. Here’s how to achieve this:
A. Basic Score Updates
The simplest method is to manually enter scores into the score cells. However, this is prone to errors. A better approach is to use simple formulas.
For example, let’s say cell C2 contains Team 1’s score. You can create two additional cells, say H2 and I2, labeled “+1” and “+3” (for a sport like basketball). In cell C2, enter the formula: `=IF(H2=1, C2+1, IF(I2=1, C2+3, C2))`
This formula checks if H2 (the “+1” cell) is set to 1. If it is, it adds 1 to the current score. If I2 (the “+3” cell) is set to 1, it adds 3. Otherwise, it keeps the score the same. You would need to reset the “+1” and “+3” cells to 0 after each update.
This is a basic example; you can expand it to handle more complex scoring scenarios.
B. Using Buttons (Developer Tab)
For a more user-friendly interface, utilize the Developer tab to insert buttons that automatically increment the score.
- Enable the Developer Tab: Go to File > Options > Customize Ribbon. In the right panel, check the “Developer” box and click OK.
- Insert Buttons: In the Developer tab, click “Insert” and choose a button (from the “Form Controls” section).
- Assign Macros: Right-click on the button and select “Assign Macro.”
- Create Macros: In the VBA editor, create macros that update the score cells. Here’s an example macro for adding 1 point to Team 1’s score (assuming the score is in cell C2):
Sub AddOneToTeam1() Range("C2").Value = Range("C2").Value + 1 End Sub - Link Macro to Button: Assign this macro to the button.
Repeat this process to create buttons for adding points, subtracting points (if needed), and controlling other statistics.
C. Time Tracking
Excel’s NOW() function can be used to track time, but it’s not ideal for a live scoreboard as it updates continuously. A better approach is to use VBA to create a timer.
- Insert a Button: Use the Developer tab to insert a “Start/Stop Timer” button.
- Create VBA Code: In the VBA editor, create a module and paste the following code (adjust cell references as needed):
Public RunWhen As Double Public Const SecsInDay As Double = 1 / 86400 Sub StartTimer() If Range("J2").Value = "Running" Then Exit Sub 'Check if timer is already running Range("J2").Value = "Running" RunWhen = Now + SecsInDay Application.OnTime earliesttime:=RunWhen, procedure:="UpdateTimer", schedule:=True End Sub Sub StopTimer() Application.OnTime earliesttime:=RunWhen, procedure:="UpdateTimer", schedule:=False Range("J2").Value = "Stopped" End Sub Sub UpdateTimer() Range("K2").Value = Range("K2").Value - SecsInDay 'Decrement time in cell K2 If Range("K2").Value <= 0 Then StopTimer MsgBox "Time's Up!" Exit Sub End If RunWhen = Now + SecsInDay Application.OnTime earliesttime:=RunWhen, procedure:="UpdateTimer", schedule:=True End Sub- J2: This cell stores the timer's status ("Running" or "Stopped").
- K2: This cell holds the remaining time, formatted as `[m]:ss` (minutes:seconds). Enter a starting time here, like `0:30:00` (30 minutes) and format the cell using `Format Cells > Number > Custom` and enter `[m]:ss`.
- Assign Macros: Assign the `StartTimer` macro to the "Start/Stop Timer" button. The same button will effectively start and stop the timer based on its current state.
This code starts a timer that decrements the time in cell K2 every second. When the time reaches zero, the timer stops and displays a message box. Remember to adjust the cell references to match your spreadsheet.
D. Conditional Formatting
Use conditional formatting to highlight important information. For example:
- Highlight the team with the highest score.
- Change the color of the time remaining cell when the game is nearing its end.
- Highlight cells that meet certain criteria (e.g., a player exceeding a certain number of fouls).
To apply conditional formatting, select the cell(s) you want to format, go to the "Home" tab, click "Conditional Formatting," and choose a rule that suits your needs.
4. Enhancing Visual Appeal
A visually appealing scoreboard is easier to read and more engaging.
- Color Scheme: Use a consistent color scheme that matches the sport or team colors.
- Fonts: Choose clear and readable fonts, and use different font sizes to emphasize key information.
- Borders and Shading: Use borders and shading to visually separate different sections of the scoreboard.
- Logos: Incorporate team logos to add a professional touch.
- Freeze Panes: Use the "Freeze Panes" feature (View tab) to keep the team names and scores visible even when scrolling through a large spreadsheet.
- Remove Gridlines: For a cleaner look, go to the View tab and uncheck "Gridlines."
5. Testing and Refinement
Thoroughly test your scoreboard to ensure that all the dynamic features work correctly and that the layout is clear and easy to use. Get feedback from others and make adjustments as needed.
6. Saving and Sharing
Save your Excel scoreboard as a `.xlsm` file (Excel Macro-Enabled Workbook) to preserve the VBA code. You can then share the file with others who can use it to track their own sports events.
Conclusion
Creating a sports scoreboard in Excel requires a bit of planning and effort, but the result is a powerful and customizable tool that can enhance the experience of any sports event. By following these steps and tailoring the design to your specific needs, you can create a professional-looking scoreboard that provides real-time updates and clear presentation of scores and statistics.
```
 640×424 create scoreboard excel techwalla from www.techwalla.com
  1171×906 scoreboard prosperspark from www.prosperspark.com
  474×1005 scoreboard design ideas scoreboard sports graphics sports design from www.pinterest.com
  640×413 create scoreboard powerpoint techwalla from www.techwalla.com
 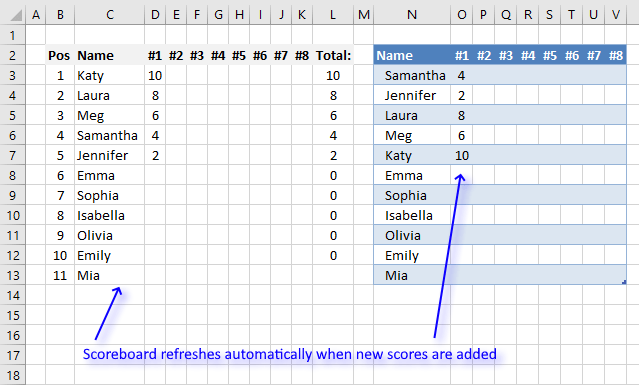 639×385 dynamic scoreboard from www.get-digital-help.com
  6002×3666 sport scoreboard template vector art vecteezy from www.vecteezy.com
  600×340 scoreboard templates sample format from www.template.net
  600×730 scoreboard templates samples excel from www.template.net
  899×1080 scoreboard sport template royalty vector image from www.vectorstock.com