How To Use Excel To Manage Bills And Receipts
Managing Bills and Receipts with Excel: A Comprehensive Guide
Keeping track of bills and receipts can feel overwhelming, but with a little Excel know-how, you can transform this chore into a manageable and even insightful process. This guide will walk you through creating a practical Excel system to effectively manage your bills and receipts, offering clarity and control over your finances.
Setting Up Your Excel Spreadsheet
1. Creating a New Workbook and Worksheet
Open Microsoft Excel and create a new workbook. Rename the first sheet (e.g., “Bills and Receipts”). This sheet will be the main hub for your financial tracking.
2. Defining Essential Columns
The key to effective bill and receipt management lies in well-defined columns. Consider including the following:
- Date: The date of the bill or receipt (e.g., 2023-10-27).
- Category: Classify the expense (e.g., Rent, Utilities, Groceries, Entertainment). A consistent categorization system is crucial for accurate reporting.
- Vendor/Payee: The company or individual you paid (e.g., Landlord, Electric Company, Supermarket, Netflix).
- Description: A brief explanation of the expense (e.g., Monthly Rent, Electricity Bill – October, Weekly Groceries).
- Amount: The total amount of the bill or receipt (e.g., 1200.00).
- Payment Method: How you paid (e.g., Credit Card, Debit Card, Cash, Check).
- Due Date: (Applicable for bills) The date the bill is due (e.g., 2023-11-05).
- Paid Date: The date you actually paid the bill (e.g., 2023-11-03). Leave blank if unpaid.
- Status: (Applicable for bills) Indicates whether the bill is Paid, Unpaid, or Overdue.
- Receipt Image: (Optional) A hyperlink to the scanned or photographed image of the receipt. This enhances record-keeping and auditability.
- Notes: Any additional relevant information (e.g., “Used coupon,” “Returned item”).
Enter these column headings in the first row of your spreadsheet (Row 1). Adjust the column widths as needed to comfortably fit the headings and data.
3. Formatting Your Spreadsheet
Proper formatting improves readability and functionality:
- Date Formatting: Select the “Date” and “Due Date” columns and format them as dates (e.g., YYYY-MM-DD, MM/DD/YYYY). Go to “Format” -> “Cells” -> “Number” -> “Date” and choose your preferred format.
- Currency Formatting: Select the “Amount” column and format it as currency. Go to “Format” -> “Cells” -> “Number” -> “Currency” and choose your desired currency symbol and decimal places.
- Conditional Formatting for Status: This helps visually identify overdue bills. Select the “Status” column. Go to “Format” -> “Conditional Formatting”. Create rules:
- Rule 1: If cell value equals “Overdue,” format the cell with a red background.
- Rule 2: If cell value equals “Unpaid,” format the cell with a yellow background.
- Rule 3: If cell value equals “Paid,” format the cell with a green background.
- Freezing the Top Row: This ensures that the column headings remain visible as you scroll down. Select the row below the headers (Row 2). Go to “View” -> “Freeze Panes” -> “Freeze Top Row”.
- Table Formatting (Optional): Convert your data into an Excel table for enhanced features like filtering and sorting. Select your entire data range. Go to “Insert” -> “Table” and ensure “My table has headers” is checked.
Data Entry and Organization
1. Consistent Data Entry
Accuracy is paramount. Double-check all entries for correctness, especially dates and amounts. Using consistent language in the “Category” and “Vendor/Payee” columns is crucial for accurate reporting later.
2. Utilizing Drop-Down Lists for Consistency
For frequently used categories and payment methods, create drop-down lists to minimize errors and ensure consistency:
- Select the “Category” column.
- Go to “Data” -> “Data Validation”.
- In the “Settings” tab, under “Allow,” choose “List”.
- In the “Source” field, enter your categories separated by commas (e.g., Rent,Utilities,Groceries,Entertainment). Alternatively, you can create a separate sheet with your categories listed in a column and refer to that range in the “Source” field (e.g., =Categories!$A$1:$A$10). This allows you to easily update your category list.
- Repeat the process for the “Payment Method” column (e.g., Credit Card,Debit Card,Cash,Check).
- For “Status” use: Paid, Unpaid, Overdue
3. Adding Receipt Images (Hyperlinks)
Storing digital copies of your receipts is highly recommended. Scan or photograph your receipts and save them in a dedicated folder on your computer or in cloud storage. Then:
- In the “Receipt Image” column, right-click on the cell corresponding to the receipt.
- Select “Hyperlink”.
- Browse to the location of your receipt image and select it.
Clicking on the hyperlink will now open the corresponding receipt image.
Analyzing Your Data
1. Sorting and Filtering
Excel’s sorting and filtering capabilities allow you to quickly analyze your spending habits:
- Sorting: Sort your data by date to see your expenses in chronological order. Sort by “Amount” to identify your largest expenses. You can sort by multiple columns (e.g., first by “Category” then by “Date”).
- Filtering: Filter by “Category” to see how much you’re spending on each type of expense. Filter by “Payment Method” to see how much you’re charging to your credit card versus paying with cash. Filter by “Status” to see all unpaid or overdue bills.
2. Using Formulas for Calculations
Excel’s formulas are powerful tools for calculating totals and summaries:
- SUM: Calculate the total amount spent in a specific category or within a specific timeframe. For example, `=SUMIF(CategoryColumn, “Groceries”, AmountColumn)` calculates the total spent on groceries. Replace `CategoryColumn` and `AmountColumn` with the actual cell ranges (e.g., `B2:B100`, `E2:E100`).
- SUMIFS: Use `SUMIFS` for more complex calculations with multiple criteria. For example, `=SUMIFS(AmountColumn, CategoryColumn, “Groceries”, PaymentMethodColumn, “Credit Card”)` calculates the total spent on groceries using a credit card.
- COUNTIF/COUNTIFS: Count the number of bills in a specific category or with a specific status.
- AVERAGE: Calculate the average amount spent on a particular category.
3. Creating Pivot Tables
Pivot tables provide a powerful and flexible way to summarize and analyze your data. They allow you to quickly group and aggregate information based on different criteria.
- Select your entire data range.
- Go to “Insert” -> “PivotTable”.
- Choose where you want to place the pivot table (e.g., a new worksheet).
- In the PivotTable Fields pane, drag and drop fields (column headings) into the “Rows,” “Columns,” “Values,” and “Filters” areas to create different summaries. For example:
- Drag “Category” to “Rows” and “Amount” to “Values” to see the total spending by category.
- Drag “Month” (derived from the Date column – Excel can automatically group dates into months) to “Rows” and “Category” to “Columns” and “Amount” to “Values” to see a monthly breakdown of spending by category.
- Drag “Status” to “Filters” to filter the pivot table to show only paid, unpaid, or overdue bills.
4. Generating Charts
Visualizing your data through charts makes it easier to identify trends and patterns:
- Select the data you want to chart (e.g., category and total spending).
- Go to “Insert” and choose a chart type (e.g., pie chart, bar chart, line chart).
- Customize the chart title, axes labels, and colors to improve readability.
Maintaining and Updating Your Spreadsheet
1. Regular Updates
Commit to updating your spreadsheet regularly, ideally weekly or monthly. This ensures that your data is accurate and up-to-date.
2. Backups
Regularly back up your Excel file to prevent data loss. Consider using cloud storage services like OneDrive or Google Drive for automatic backups.
3. Review and Refine
Periodically review your spreadsheet setup and identify areas for improvement. Adjust your categories, add new columns, or refine your formulas as needed.
Conclusion
By following these steps, you can create a robust and effective Excel system for managing your bills and receipts. This system will not only help you stay organized but also provide valuable insights into your spending habits, empowering you to make informed financial decisions. Remember consistency and regular maintenance are key to maximizing the benefits of this system.
 804×1259 manage bills spreadsheet manage bills spreadsheet excel from db-excel.com
  686×970 manage bills spreadsheet db excelcom from db-excel.com
  1140×912 manage bills spreadsheet grey desk spreadsheets intended from db-excel.com
  1024×1024 manage bills spreadsheet manage bills spreadsheet from db-excel.com
  1400×758 excel spreadsheet bills db excelcom from db-excel.com
  1024×576 set excel spreadsheet bills excelxocom from excelxo.com
  728×546 track bills microsoft excel steps from www.wikihow.com
 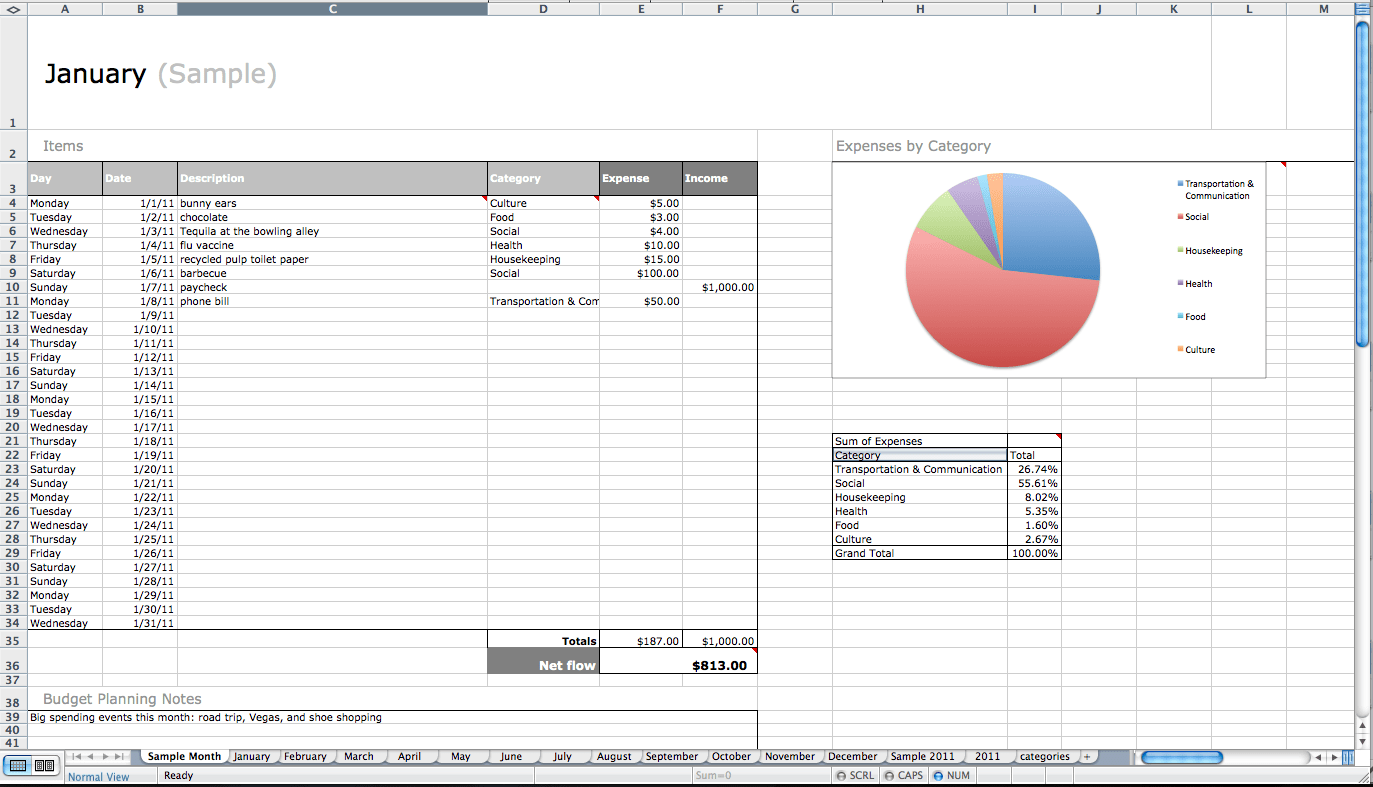 1373×787 track expenses excel db excelcom from db-excel.com
  474×224 bill payment spreadsheet excel templates excel templates from www.exceltemplate123.us